If you're using NetSuite, or if you're considering it but not sure if it's right for you, one of the biggest value points to consider is the ability to use built-in financial dashboards. Many NetSuite customers cite dashboards as one of the software's most important features and the feature that makes it easier to run their business and get more done.
But what does that really mean? What are NetSuite dashboards, and why does it matter so much for making good business decisions? The main reason is that dashboards offer strong insight information, and taking advantage of everything they have to offer makes it easier for NetSuite users to see everything in one place and get the knowledge they're looking for.
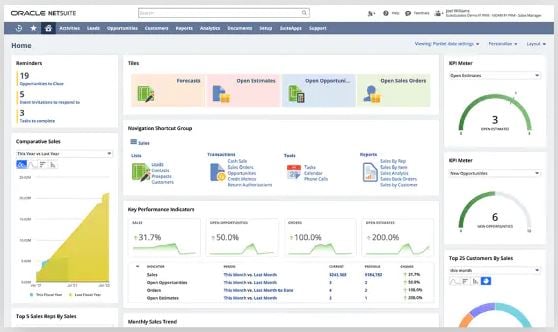 Netsuite Financial Dashboard
The best news is that you can set up dashboards in just a few minutes, and then you'll be able to get quality information from them in the long term. Here's what to know when you want to get the most from your NetSuite experience through the use of dashboards.
Tracking KPIs has Never Been Easier
To keep your business' finances in check you want to be able to track your key performance indicators (KPIs). There are several ways you can do that with NetSuite dashboards. With the Key Performance Indicators Portlet, there are more than 75 KPIs you can choose from, including expenses, income, and bank balance. These are preset, so you can just select what you need.
You can also add custom KPIs, allowing you to have more specifics than what's offered with presets, or add a particular metric you're interested in tracking more fully. The compare and date ranges let you see details of one metric against another one, for any time period that works for you, and if you want to see certain metrics at the top you can easily "headline" them.
Among the best features of this kind of dashboard financial tracking through NetSuite, is that all the information for the KPIs is linked. You can click anything you need to, and view the data source in order to get more details and see where all your company's needed information is collected from.
Check Performance Easily With the KPI Meter
If you want to see your performance in specific areas and how it relates to the threshold you want to meet, you can use the KPI meter to do that. It's like a speedometer, showing you how "fast" you're going in relation to where you want to be. You might want to try to get above a certain point, or stay below it, depending on the specific metric you're using.
With green, yellow, and red on the meter depending on where you are, it's easy and convenient to see where you're supposed to be and how close you are to optimize your operations. You can also have three KPI meters on your NetSuite dashboard, so you can track the most important metrics in a way that shows you whether you're on target or need to make some adjustments.
Keep Score for More Complex Comparisons
Another valuable option for your financial NetSuite dashboard is the use of the scorecard feature. This shows a longer time range and includes a more complex comparison. You'll have more than just a single comparison range, giving you additional details. There are some preset options, but you can also create your own to have additional value on your dashboard.
Inventory turnover, gross profit percentage, and other details of how your business is operating are all available when you use the scorecard feature. Creating the scorecards that are most important to you adds to the benefit, since the preset options may not be enough, or may not be what you specifically want to track to see the health of your business.
Graphs and Charts Make Visualization Easier
While having the financial metrics that address the health of your company is the most important thing, it's much easier to visualize all of that with charts and graphs. You can use your NetSuite dashboard to see graphs for up to three KPIs, whether those are preset options or more unique choices.
With the ability to color-code and compare metrics with line, bar, column, and area graphs and charts, you can quickly see how your company is doing and which metrics are standing out when compared to others. Charts can also be exported as PDFs or images, so you can share them with others to provide details on your company. The use of financial dashboards can really help you get the most from your NetSuite experience.